Learn · Reality capture fundamentals
What Is a Point Cloud? Plain-English Guide with Real Examples
By the ScanningAndModeling team · Last updated July 9, 2026
A point cloud is a set of millions of individual measurement points in 3D space, each carrying X, Y, Z coordinates and often color, captured by a laser scanner or photogrammetry. It is the raw dataset behind every scan-to-BIM model, as-built drawing, and floor plan. On its own it is not a model; it is the measured evidence a model is built from.
The plain-English definition
Stand in a room and point a laser at every surface. Each time the laser hits something, the scanner records exactly where that hit happened in three-dimensional space. Do that hundreds of thousands of times per second, from several positions, and the result is a point cloud: a dense field of measured dots tracing every wall, pipe, beam, and doorway in the building.
That is the entire concept. No drawing, no interpretation, no modeling. A point cloud is measurement, recorded at a scale no tape measure reaches. It sits at the base of reality capture, the umbrella term for digitally recording an existing built environment, and every deliverable in this industry is built on top of it.
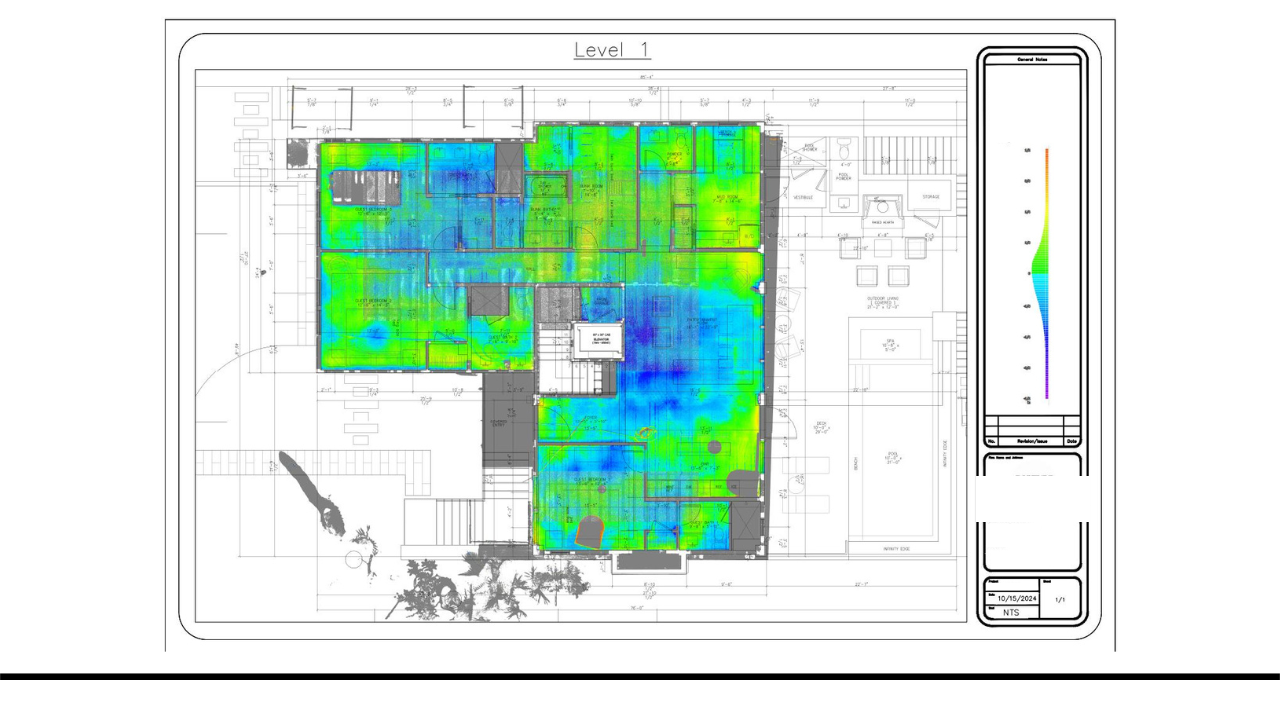
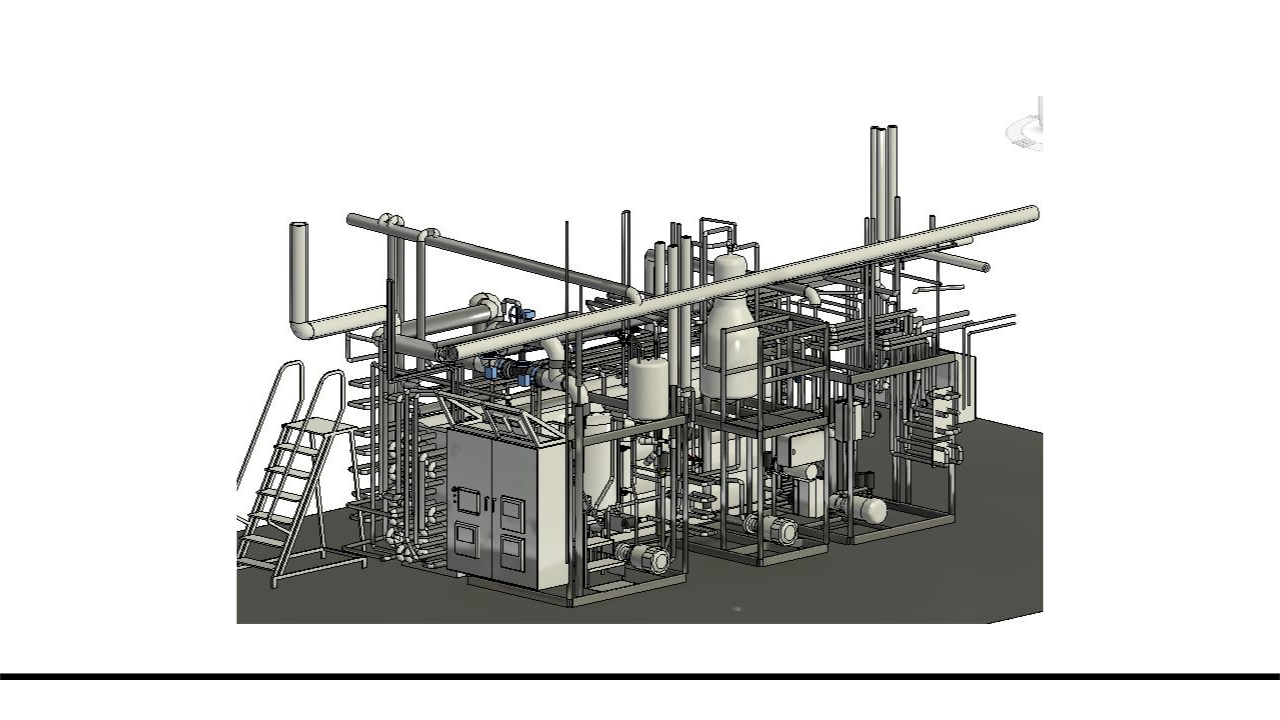
The two images below show what a point cloud becomes. A floor flatness heatmap reads elevation straight off the measured points, and a 3D model of the mechanical systems is built on top of the same cloud. Both are measurable on a screen.
How a point cloud gets made
Four capture methods produce point clouds in U.S. practice. They differ in accuracy, speed, and cost, and those differences decide what the data is good for downstream.
Terrestrial laser scanning
A terrestrial scanner sits on a tripod: a Leica RTC360, a FARO Focus, a Trimble X12. It spins a laser through the space and records millions of measured points, holding 2 to 4 millimeter accuracy at 10 to 20 meters. The technician moves the tripod through the building one setup at a time, and registration software later stitches every setup into a single unified cloud. This is the method behind engineering-grade work: renovation design, construction verification, as-built documentation. When a measurement is going to drive a drawing, a fabrication decision, or a clash check, the data comes from a tripod.
Mobile SLAM scanning
Mobile scanners are worn or carried: the NavVis VLX, Leica BLK2GO, FARO Orbis, Gexcel Heron. The operator walks the building while the unit scans continuously, and a SLAM algorithm, simultaneous localization and mapping, computes where the scanner was at every instant. Typical accuracy is 1 to 3 centimeters. What SLAM gives up in precision it returns in speed: an operator covers hundreds of thousands of square feet in the time a tripod covers one floor. It is the right method for large facilities, space planning, and documentation where a centimeter of tolerance does the job.
360° capture
The Matterport Pro3 captures a building as a series of 360-degree panoramas with a LiDAR sensor attached. Accuracy is about 20 millimeters at 10 meters. The output is visual first: a walkthrough anyone opens in a browser and clicks through room by room. It is excellent for leasing tours, insurance documentation, and stakeholder communication, and weak for engineering, where 20 millimeters misses the tolerance design work requires. The full breakdown is in our comparison of Matterport and survey-grade LiDAR scanning.
Drone photogrammetry
Drones capture exteriors, roofs, and large sites: a DJI Matrice, a WingtraOne, a Skydio rig flying with RTK positioning. Photogrammetry software converts hundreds of overlapping photos into a point cloud by triangulating shared pixels across frames. Accuracy is set by the flight plan, the camera, and the ground control on site, which is why drone deliverables are specified per project rather than off a spec sheet. For the outside of a building, a campus, or open acreage, this is the method that reaches what a tripod cannot.
What each point actually contains
Open a point cloud in a data viewer and it reads like a spreadsheet with millions of rows. Each row is one point. Three numbers, X, Y, and Z, place the point in space relative to the project origin. Most points carry two more attributes. Intensity records how strongly the laser bounced back, which is why raw scans render in grayscale where concrete, steel, and drywall each read differently. RGB color comes from the scanner's cameras, draped over the points so the cloud looks like a photograph from a distance.
That is the entire data structure. Everything else in this industry, the Revit models, the floor plans, the clash reports, is interpretation built on those rows.
Density and accuracy: why not all point clouds are equal
Two separate qualities decide what a point cloud is worth: accuracy and density. Accuracy is how close each point sits to the true surface it measured. Density is how many points land per square foot. A cloud can be dense and inaccurate, sparse and precise, or both. Two clouds of the same building look nearly identical on a screen while differing tenfold in measurement quality, and the capture method sets the ceiling.
| Capture method | Example hardware | Typical accuracy | Best fit |
|---|---|---|---|
| Terrestrial laser scanning | Leica RTC360, FARO Focus, Trimble X12 | ±2-4 mm at 10-20 m | Design, engineering, construction as-builts |
| Mobile SLAM | NavVis VLX, Leica BLK2GO, FARO Orbis, Gexcel Heron | 1-3 cm | Fast capture of large areas |
| 360° capture | Matterport Pro3 | ~20 mm at 10 m | Virtual walkthroughs, visual documentation |
| Drone photogrammetry | DJI Matrice, WingtraOne, Skydio with RTK | Set by flight plan and ground control | Exteriors, roofs, large sites |
The accuracy that matters is the accuracy your downstream work requires. A renovation architect working to construction tolerances needs millimeters. A facility manager mapping space needs centimeters. Buying more precision than the work uses is money spent on decimal places nobody reads, and buying less is rework waiting to happen.
Point cloud file formats: E57, RCP, LAS, PTS
Point clouds travel in a handful of file formats, and the format you receive decides how much friction your team meets on day one.
| Format | What it is | When to request it |
|---|---|---|
| .E57 | Vendor-neutral open standard for scan data | Archiving and handoff between software platforms |
| .RCP | Autodesk ReCap project format | Your team works in Revit or AutoCAD; it links straight in |
| .LAS | The standard of the aerial and survey world | Drone, aerial, and survey workflows |
| .PTS | Plain-text ASCII point list | Simple exchange with older pipelines; large files |
Two of these do the real work on buildings. .RCP and .E57 are the two raw registered point cloud formats buyers receive on commercial projects. Request the E57 alongside any RCP delivery: the RCP serves your Revit team today, and the E57 is the archive copy that still opens when your software stack changes.
How to read a point cloud
A point cloud reports on its own quality before any software measures a thing. Four things to look at when a deliverable lands.
Coverage and density
Orbit the cloud and look for holes. Shadows behind furniture and equipment are normal in small doses; the scanner only records what the laser can see. Entire walls or corners of missing data mean the field crew skipped setups, and that gap becomes guesswork in every drawing built from the file.
Color and intensity
Most viewers toggle between true color and intensity grayscale. True color is easier to navigate. Intensity is often more honest: it shows the raw laser returns without the camera imagery smoothing anything over, which makes thin data and weak surfaces easier to spot.
Noise
Zoom in on a flat wall. A clean scan shows a crisp, thin band of points. A noisy scan shows fuzz, points scattered a centimeter deep where a flat surface should be. Glass and mirrors produce ghost geometry, and people walking through the scan leave streaks. Good processing removes most of it; heavy noise left in the file tells you how much care went into the deliverable.
Registration seams
A cloud is dozens or hundreds of scan positions stitched together. Where the stitching fails, you see a double wall: the same surface twice, offset by the alignment error. Ask for the registration report with any terrestrial deliverable. It states the alignment error in numbers, and a provider doing quality work hands it over without being asked twice.
What you turn a point cloud into: the 7 deliverables
Nobody commissions points for their own sake. The cloud is evidence, and seven deliverables get built from it.
- The registered point cloud itself, delivered as RCP or E57, for teams that measure and model in-house.
- A scan-to-BIM model: a Revit model built from the cloud at a specified Level of Development. Our guide to what scan-to-BIM is and how LOD 200, 300, and 350 differ covers the spec language.
- 2D as-built drawings: floor plans, elevations, and sections drafted from the cloud, delivered as DWG or PDF.
- A virtual walkthrough: the Matterport-style tour, built for viewing rather than measuring.
- Floor flatness and levelness analysis (FF/FL) per ASTM E1155, for slabs and industrial floors.
- Clash detection: the cloud checked against a design model to catch conflicts before they reach the field.
- Digital twins and specialty outputs, from facility-management datasets to critical-incident maps for schools.
This is what finished work looks like: as-built models produced from point cloud data, captured and modeled by ScanningAndModeling.
Explore one yourself
The fastest way to understand scan data is to move through some. Open this walkthrough of a building we captured and click through it room by room. Every view you stand in is position data captured on site.
One distinction as you explore: a walkthrough like this is built for viewing, in the 20 millimeter accuracy class. An engineering point cloud carries the same building at millimeter precision, in files measured in gigabytes rather than a browser tab. Same idea, different tool for a different job.
What a point cloud costs to commission
A small commercial building, 5,000 to 15,000 square feet, runs $3,000 to $8,000 for a point cloud alone. That buys one to two days of fieldwork plus registration and processing. At the other end of the scale, a residential or Matterport-tour capture runs $350 to $2,000. Modeling and drafting are priced on top of the cloud, not included in it.
The full price ladder, from a single tour to a multi-building campus, with the line items a quote should show, is in our 2026 guide to 3D laser scanning costs with real numbers.
Questions buyers actually ask
Can I open a point cloud in Revit?
Yes, through an .RCP export from Autodesk ReCap or Leica Cyclone. The catch is knowing to ask for the right export; a raw .E57 file needs conversion before Revit reads it.
What file format should I request?
E57 for vendor-neutral archiving, RCP if your team works in Revit or AutoCAD, LAS for aerial and survey workflows.
Is a point cloud the same as a BIM model?
No. The point cloud is measured raw data. A BIM model is built from it at a specified Level of Development, usually LOD 200, 300, or 350. The model is drawn by a modeling team and priced separately from the scan, which is why a scan does not include the model unless you commission both.
How accurate is a point cloud?
It depends entirely on the capture method: 2 to 4 millimeters for tripod-mounted terrestrial scanners, 1 to 3 centimeters for mobile SLAM, and about 20 millimeters for a Matterport Pro3.
How much does a point cloud cost?
A small commercial building of 5,000 to 15,000 square feet, point cloud only, typically runs $3,000 to $8,000. Field time is one to two days plus processing.
Next step
Tell us the building, the square footage, and what the data needs to do. We come back with the right capture method, the right deliverable, and a real number.
Get a quoteAbout the author
The ScanningAndModeling team writes these guides from the field: the people who scan, model, and deliver reality-capture work across the country every week. Plain-English answers with real numbers, so you can spec a project without guessing.