Learn reality capture
One Scan Becomes Everything: The Derivation Tree
By the ScanningAndModeling team · Last updated July 16, 2026
A laser scan captures the complete geometric truth of a place one time, as a point cloud of millions of measured points at survey-grade accuracy. Everything else you might ever need from that building, floor plans, a Revit model, a first-responder incident map, a lease exhibit, a flatness analysis, fabrication geometry, a walkthrough, is derived from that single dataset, now or years later, without going back to the site. That is the whole idea. The scan is not a deliverable. It is the source that every deliverable is cut from.
Most buyers meet reality capture through one narrow need: an architect wants existing conditions, a facilities director wants a lease drawing, a safety officer wants a map for police and fire. So they buy that one thing and move on. What they rarely see is that the capture behind all three needs is identical. The same point cloud that produces the architect's model produces the lease exhibit and the incident map. Buy the capture once, and the deliverables become a menu you can order from for the life of the building. This guide walks the full menu, with the standards and the file realities that make each branch legitimate, and shows how we stay with you as the next need appears.
The source: what a scan actually records
A terrestrial laser scanner sits on a tripod and sweeps the space around it, measuring the distance and angle to every surface it can see, hundreds of thousands to over a million points per second. Each point is stored as an X, Y, Z coordinate, and most captures also record color and intensity per point. Set the scanner in enough positions to see every surface that matters, then merge those positions into one coordinate system, and you have a registered point cloud: a dimensionally accurate, measurable replica of the space as it existed on the day of capture. Survey-grade terrestrial instruments hold roughly two to four millimeters of positional accuracy at ten to twenty meters, and that number is the accuracy budget every downstream deliverable inherits. If the raw data side is new to you, our plain-English guide to what a point cloud is covers the formats and the coordinate math in depth. This guide assumes the cloud exists and focuses on what you build from it.
The important property, the one this entire page turns on, is that the point cloud is evidence, not interpretation. It does not decide what a wall is or where a lease boundary falls. It records where every surface physically was, to the millimeter, and leaves the interpretation to whatever deliverable you derive next. That neutrality is exactly why one capture can feed a dozen unrelated purposes. Nothing about the measurement presumes the use.
The derivation tree, branch by branch
Here is the tree at a glance, from the raw capture at the root out to every finished product. Each branch below gets its own section: what it is, who uses it, and what decision it feeds.
Registered point cloud (the source)
├─ 2D documentation: floor plans, elevations, sections, reflected ceiling plans, electrical plans
├─ 3D and BIM: Revit models at LOD 200 through 500
├─ Critical incident maps for first responders
├─ Facility and space documentation: BOMA area, lease exhibits, space planning
├─ Analysis products: floor flatness and levelness, wall plumbness, structural deformation
├─ Fabrication-grade geometry: handrails, millwork, prefabricated MEP spooling
├─ Virtual walkthroughs
└─ Site and topographic data (paired with drone capture)
Branch 1: 2D as-built documentation
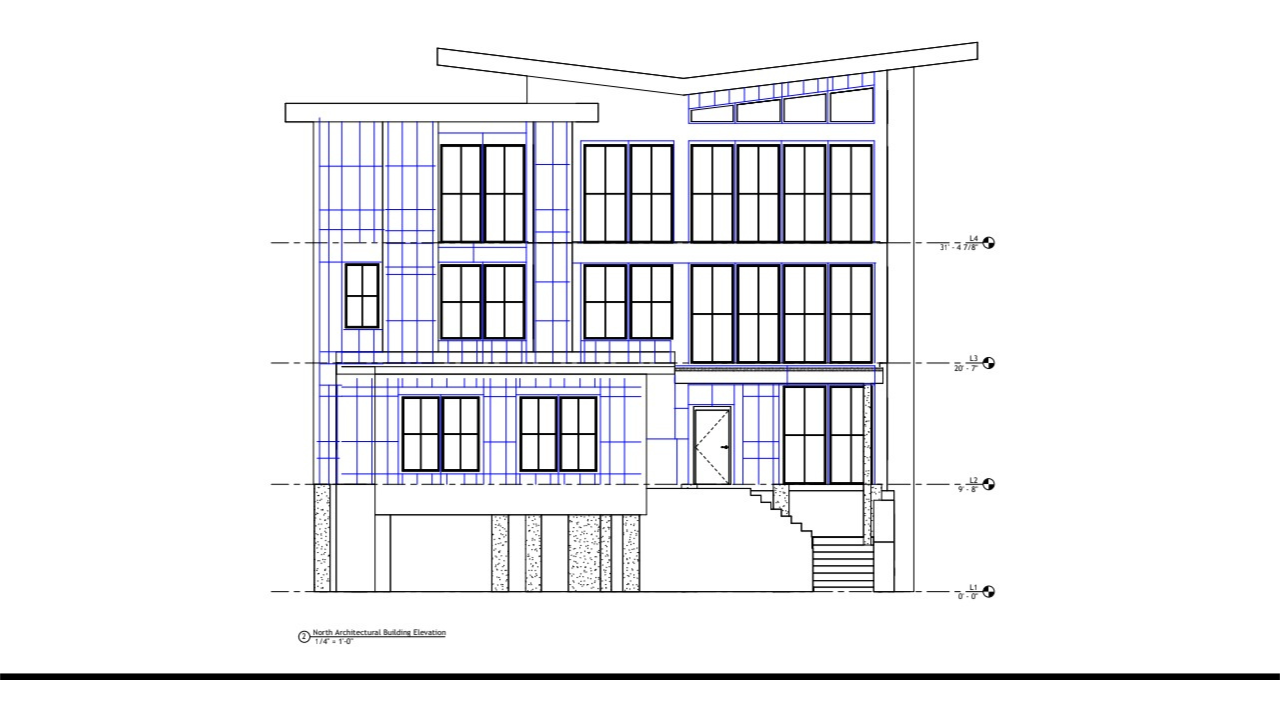
The most familiar deliverable, and the one most people picture when they say "as-builts." From the point cloud a drafter cuts horizontal and vertical slices and traces them into scaled 2D drawings: floor plans with real wall thicknesses and dimensioned window and door openings, exterior and interior elevations, building sections, reflected ceiling plans that show grid, fixtures, and diffusers as seen looking up, and electrical plans that locate panels, devices, and fixtures. These are the CAD sheets, delivered in .DWG or .PDF, that architects, engineers, and permit reviewers actually mark up. Because they are cut from measured points rather than a decades-old paper set, the dimensions reflect what is physically there today, including every undocumented renovation the original drawings never captured. Who uses them: design teams starting a renovation, permit and code officials, tenant coordinators, and any trade that needs a dimensioned sheet to bid from.
Branch 2: 3D and BIM models, at the Level of Development the job needs
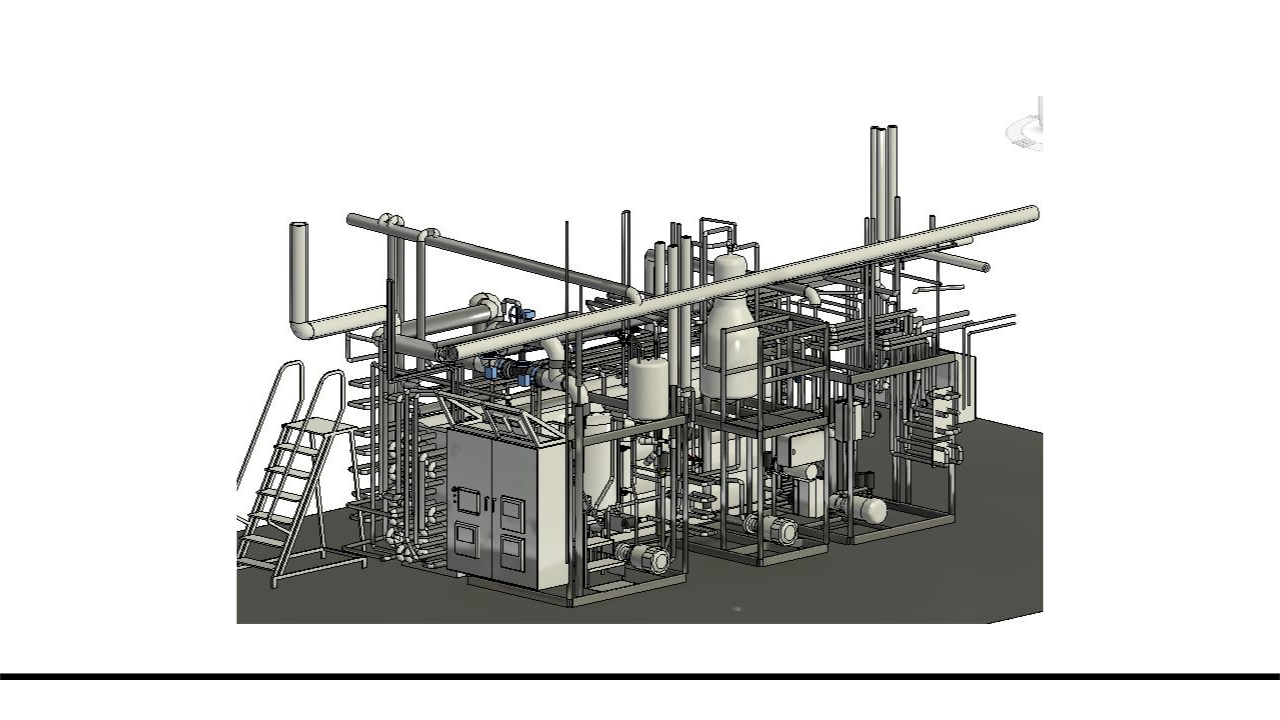
Trace the point cloud in three dimensions instead of two and you get a Building Information Model, usually in Revit, where each element is intelligent: a wall knows it is a wall, carries its dimensions, and reports to a schedule. How much gets modeled, and in what detail, is governed by a contract term called Level of Development. The scale runs from LOD 100 to LOD 500 under the AIA framework, and the BIMForum Level of Development Specification, updated in its 2025 edition, defines each level by five geometric characteristics: quantity, size, shape, location, and orientation. Here is the ladder in owner terms.
| LOD | What the model element contains | Derive it when |
|---|---|---|
| 100 | Conceptual: represented by a symbol or generic massing, not true geometry | Early feasibility and rough area studies |
| 200 | Approximate geometry: generic elements with approximate size, shape, location, orientation | Space planning, test fits, schematic design |
| 300 | Accurate geometry: specific size, shape, and location, measured from the scan | Design development on architectural scope |
| 350 | LOD 300 plus modeled interfaces and connections between building systems | MEP coordination and clash detection |
| 400 | Fabrication and assembly detail, suitable for shop work | Prefabrication and shop drawings |
| 500 | Field-verified representation of the as-built asset | Facility management systems of record |
Two notes that save money. First, LOD 350 exists because of scan work specifically: the AIA gap between LOD 300 (where a duct is) and LOD 400 (fabrication) was too wide for trade coordination, which needs to know how that duct connects to the equipment beside it. The 2025 edition also introduced an optional LOD 250 to bridge the space between 200 and 300. Second, the most common and most expensive buyer mistake is specifying a number instead of an outcome. An owner asks for LOD 300, receives a clean LOD 300 model, then complains it "does not show the mechanical details." Those details are LOD 350 content, they take more modeling hours, and they cost more. State what the model must do downstream and the correct LOD falls out of that. Our full scan-to-BIM explainer walks the accuracy standard and the RFP language that pins this down in a contract.
Branch 3: critical incident maps for first responders
The same interior geometry that an architect models can be reframed entirely for police, fire, and EMS. A critical incident map takes the measured floor plan and overlays a labeled grid, standardized room and door numbering, hazard and utility shutoff locations, access points, and staging areas, formatted to load into the dispatch and mapping software that responding agencies already run. The point is speed under stress: a first arriving unit can name a location precisely and route to it without knowing the building. Because the map is derived from a survey-grade capture rather than a hand sketch, the grid coordinates correspond to real measured positions inside the structure. This branch matters most for schools, hospitals, large workplaces, and public venues, and it is increasingly tied to funding and compliance requirements. We treat this deliverable in full in how critical incident mapping works, including the gridding conventions and how the output reaches dispatch systems.
Branch 4: facility and space documentation
Owners, property managers, and brokers need the building expressed as area and boundaries, not as design geometry. From the point cloud you derive rentable and usable area calculations under the BOMA floor measurement standards, the office standard being ANSI/BOMA Z65.1, which has been the ANSI-secretariat method for measuring office floor area for over a century. The same data produces lease exhibits, stacking and space plans, and occupancy documentation. Because BOMA rentable area drives what a tenant actually pays, deriving it from measured conditions rather than from an old plan removes a recurring source of dispute: the walls in the drawing and the walls in the building are, at last, the same walls. Who uses this branch: landlords and asset managers setting rent, brokers preparing lease exhibits, corporate real estate teams planning moves, and facilities groups maintaining a space system of record.
Branch 5: analysis and quality products
Some of the most valuable outputs are not drawings at all. They are measurements of how far reality departs from an ideal, computed directly against the millions of captured points. Deviation analysis compares the cloud to a flat plane, a design surface, or an earlier scan, and renders the result as a color heatmap where every hue is a real distance.
- Floor flatness and levelness. The construction standard for this is ASTM E1155, the Standard Test Method for Determining FF Floor Flatness and FL Floor Levelness Numbers. FF grades local bumpiness over short distances, which governs how small-wheeled equipment rolls, and FL grades how close the slab is to a true horizontal plane over long distances. Higher numbers mean flatter and more level. A scan-derived flatness heatmap shows exactly where a slab is out of tolerance before flooring, racking, or precision equipment goes down.
- Wall plumbness and straightness. The cloud reveals lean and bow in walls and columns to the millimeter, which matters for curtain wall interfaces, elevator shafts, and tilt-up panel acceptance.
- Structural deformation and change over time. Compare a scan against a prior scan of the same structure and you measure settlement, deflection, or movement directly, the basis for monitoring an aging or loaded structure.
Who uses this branch: general contractors verifying slab acceptance, structural engineers assessing existing conditions, and facility owners monitoring a building over its life.
Branch 6: fabrication-grade geometry
When something has to be built to fit conditions exactly, the point cloud becomes the template. Fabricators derive geometry precise enough to manufacture against: handrails and stairs that match a real, out-of-square opening, casework and millwork cut to walls that are not truly straight, and prefabricated mechanical, electrical, and plumbing assemblies, spooled and built offsite to route through the space as it actually is. This is the LOD 400 end of the modeling spectrum, and it pays for itself by eliminating the field rework that happens when shop-built parts meet a building that never matched its drawings. Who uses this branch: steel and millwork fabricators, MEP contractors running prefabrication, and specialty trades installing into finished conditions.
Branch 7: virtual walkthroughs
The most accessible deliverable, and deliberately not the first on this list. A virtual walkthrough turns the capture into a navigable visual model you tour in a browser, room to room, without being on site. It is the right tool when the job is to see a building rather than to measure or model it: remote stakeholder tours, leasing and marketing, insurance and condition documentation, and orientation for teams who will never open a CAD file. It is an entry point, not a ceiling. A walkthrough answers "what does this space look like," while the branches above answer "what are its exact dimensions, how do I build in it, and what does it cost to occupy." Our Matterport versus LiDAR comparison draws the line between visual walkthrough capture and survey-grade measurement so you buy the accuracy the job needs and no more.
Branch 8: site and topographic data
Extend the capture outdoors and the tree grows a site branch. Drone photogrammetry and aerial LiDAR add terrain, roof, and site context that a ground scanner cannot reach, producing topographic surfaces, contour lines, volume calculations for cut and fill, and orthomosaic imagery. Merged with the interior terrestrial scan into one coordinate system, the result is a continuous dataset from the property line through the roof. Who uses this branch: civil engineers and site designers, earthwork contractors quantifying volumes, and campus or facility owners who need the grounds documented alongside the buildings.
Why the scan compounds in value
Here is the argument that changes how you should think about the spend. A deliverable is consumed. A scan is an asset. When you buy a floor plan, you get a floor plan. When you buy the capture, you get the source that a floor plan, and everything else on the tree, is derived from, this year and in five years.
Buildings generate needs on a schedule nobody can predict. A renovation gets funded. The property sells and a broker needs a lease exhibit. A safety mandate arrives and the campus needs an incident map. An insurer wants condition documentation after a storm. Each of those is a new deliverable, and each one, if you own the registered point cloud, is a derivation against data you already paid for, not a new mobilization to the site. The marginal cost of the next deliverable drops to the modeling or drafting labor alone, because the expensive part, getting a crew to the building and capturing it accurately, is already done.
The honest limit is worth stating plainly, because it decides re-scan versus re-derive. A point cloud is a record of the building on the day it was captured. As long as the physical conditions you care about have not changed, every new deliverable is a re-derivation from the existing cloud, fast and inexpensive. Once conditions have changed in the area that matters, a wall moved, a system replaced, an addition built, that region has to be re-captured, because the cloud can only ever tell the truth about the day it was made. The practical rule: re-derive when the building is the same and the need is new; re-scan the affected area when the building itself has changed. Most follow-on needs fall in the first case, which is exactly why the asset compounds. This is also why timing matters on new construction: capturing a home before drywall records every wire, pipe, and stud while they are still exposed, then a second capture at completion documents the finished result, a sequence we detail for custom home builders.
How the project actually runs, start to finish
Some clients hand us a full spec sheet. Others describe the end result they want. Both get the same outcome, because translating the goal into the correct deliverable is work we carry. Here is the whole arc.
Step 1: scoping conversation
It starts with a plain conversation about what you are trying to do. Not "what LOD do you want," but "we are renovating the second floor," or "the fire marshal is asking for a map," or "we are re-leasing and the square footage is in dispute." From that, we translate the outcome into the deliverable and the accuracy it requires, and we tell you which branches of the tree the same capture can also serve while a crew is on site, so you are not paying twice later for a need you already know is coming. You describe the goal. We specify the scan.
Step 2: capture day
A technician captures the space from enough scanner positions that every surface the deliverables require is seen. Coverage is the whole game here: what the scanner never saw cannot appear in any downstream product, so the capture plan is built backward from the deliverables scoped in step one. For interiors that means terrestrial scanning; for sites and roofs it means adding aerial capture. We plan access, occupancy, and any sensitive areas with you in advance so the day runs cleanly around your operations.
Step 3: registration, processing, and QC
Back from the field, the individual scanner positions are registered into one unified point cloud in a single coordinate system, and the registration is checked for how tightly the scans agree. The cloud is then reviewed for coverage gaps, noise, and seams before any deliverable is built on top of it, because errors in the cloud propagate into every drawing and model traced from it. This quality step is where field discipline becomes a number you can trust.
Step 4: delivery, in formats your software opens
You receive the deliverables scoped for the project in the formats your team actually works in. In practice that means some combination of the following.
| Deliverable | Typical format | Opens in |
|---|---|---|
| 2D drawings (plans, elevations, sections) | .DWG, .PDF | AutoCAD, and any PDF reader |
| BIM model | .RVT, .IFC | Revit, and IFC-compatible BIM tools |
| Registered point cloud | .RCP, .E57 | Revit and AutoCAD (.RCP), vendor-neutral archive (.E57) |
| Incident map | Dispatch-software-ready package | The responding agencies' mapping systems |
| Area and lease exhibits | .PDF, .DWG, spreadsheet | Standard office and CAD software |
| Analysis heatmaps | .PDF report, annotated model | Any PDF reader, and BIM viewers |
| Virtual walkthrough | Hosted link | Any web browser |
We confirm software versions at kickoff so files open cleanly in your environment on day one, and we deliver the registered point cloud itself as part of the package. You paid for the capture; you should hold the source asset that every future deliverable derives from.
Step 5: when the next need appears
The project does not end at delivery, because the building keeps generating needs. When the next one arrives, a renovation, a sale, an incident-plan update, an insurance claim, you come back to the same source. If the conditions are unchanged, we derive the new deliverable from the cloud we already hold for you. If something in the building has changed, we re-capture that area and update. Either way you are not starting over, and you are not re-explaining the building. We already have it.
One capture, both the compliance need and the facilities need
This is where the derivation tree matters most for buyers working against a grant deadline or a safety mandate. The capture that produces a critical incident map for first responders is the same capture that produces the facilities and renovation deliverables the building will need anyway. A school district mapping its campuses for responder access already holds, in that one dataset, the source for accurate floor plans, area documentation, and renovation models. The compliance dollar and the facilities dollar buy the same scan.
If a funded mandate is driving your project, plan the capture once and derive both sides. Our security grant funding guide covers how these programs work and what they will pay for, and school campus mapping requirements details what a compliant map actually has to contain. Scope the capture against both, and a single mobilization serves the mandate and the building's long-term documentation at the same time.
The standards named in this guide
Depth is only worth anything if the references are real. The three standards that govern the branches above, and where to read them:
- Level of Development. BIMForum Level of Development Specification, 2025 edition, which defines LOD 100 through 500 by quantity, size, shape, location, and orientation.
- Floor area measurement. ANSI/BOMA Z65.1, the BOMA office floor measurement standard, alongside the industrial, gross area, and mixed-use standards in the same family.
- Floor flatness and levelness. ASTM E1155, the Standard Test Method for Determining FF Floor Flatness and FL Floor Levelness Numbers.
Questions buyers actually ask
Do I have to know which deliverable I need before I call?
No. You describe what you are trying to accomplish in plain terms. We translate that into the deliverable and the accuracy it requires, and we tell you which other needs the same capture can serve so you are not paying to scan the building twice.
Can one scan really produce all of these?
One registered point cloud is the source for all of them. Each deliverable is a different way of interpreting the same measured points: a 2D slice, a modeled element, an area boundary, a graded grid, a heatmap. The interpretation differs; the underlying capture does not.
If I only need a floor plan now, is the scan still worth it?
The scan costs about the same whether you derive one deliverable from it or eight, because the expensive part is the field capture. Owning the point cloud means the next deliverable, whenever the building generates the need, is a fast re-derivation instead of a new site visit.
What happens if the building changes later?
A point cloud is accurate as of the day it was captured. If conditions in the area you care about have not changed, we derive new deliverables from the existing cloud. If they have changed, we re-capture that area and update. Unchanged areas never need re-scanning.
Do I get to keep the raw scan data?
Yes. We deliver the registered point cloud in .RCP and .E57 as part of the package. It is the source asset behind every future deliverable, and you should hold it.
About the author
The ScanningAndModeling team
The ScanningAndModeling team writes these guides from the field: the people who scan, model, and deliver reality-capture work across the country every week. Plain-English answers with real numbers and real standards, so you can spec a project without guessing.